Fleet Society Director Ben Costello asked me to post an update related to web analytics for the first quarter of 2022. Altogether the results were fantastic and we saw the 1715 Fleet Society Web Analytics in Q1 2022 compared to Q4 2021. We also set a few new records, which are listed below.
Page Views Increase 111%
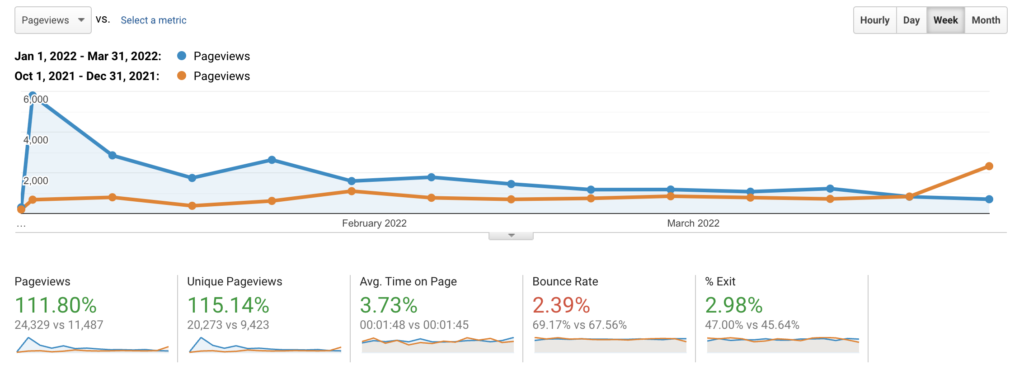
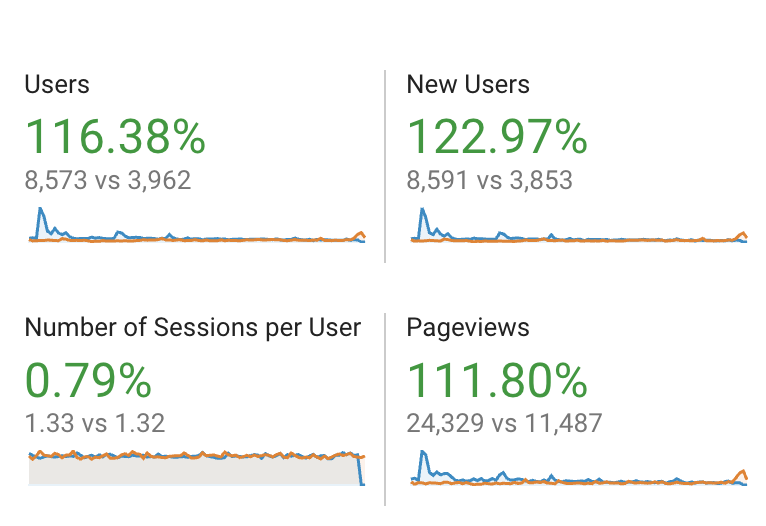
1715 Fleet Society Web Analytics for Q1 2022 more than doubled compared to Q4 2021. January 2022 saw significantly increased traffic – nearly double that of last January’s traffic. February was elevated and March was on par with what we saw last year, though slightly elevated. Together, they contributed to a total of more than 24,000 page views in the first quarter of the year compared to 11,000 page views in Q4 2021. That’s a 111% increase quarter over quarter.
Unique User Increases Make Q1 Top Quarter in Site’s History
Almost 9,000 unique users visited the site this quarter, which overtakes the third quarter of 2015 as the single biggest user visitation in the website’s history. This quarter also became the top quarter in terms of unique page views, and the second-largest quarter in terms of overall page views. Remember, Q3 2015 was when we were promoting the 300th-anniversary events and previously held most of our records for web visitors and pageviews. This is an impressive growth chart showing the base of the site’s support is widening.
1715 Fleet Society Visitor Geography
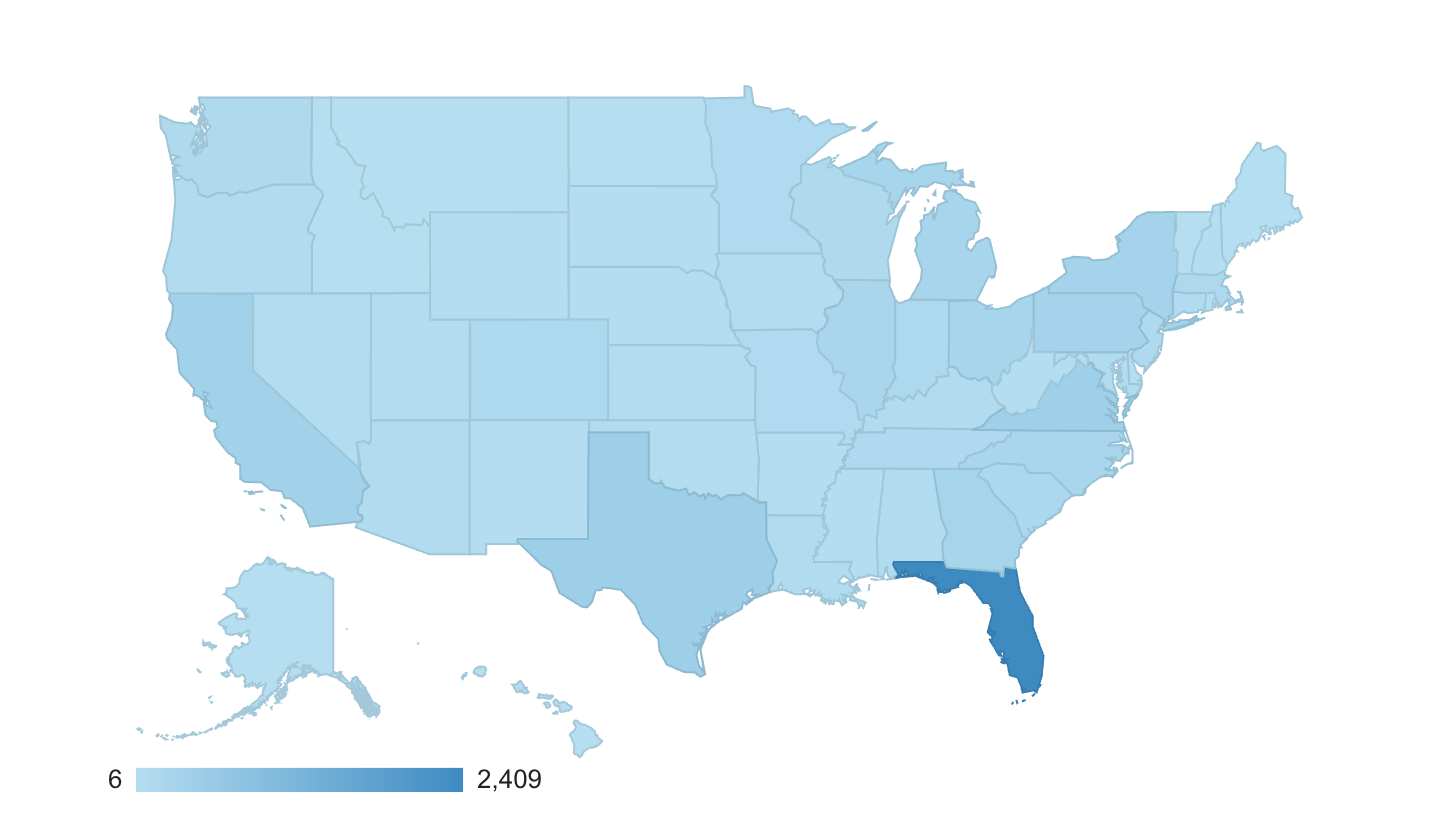
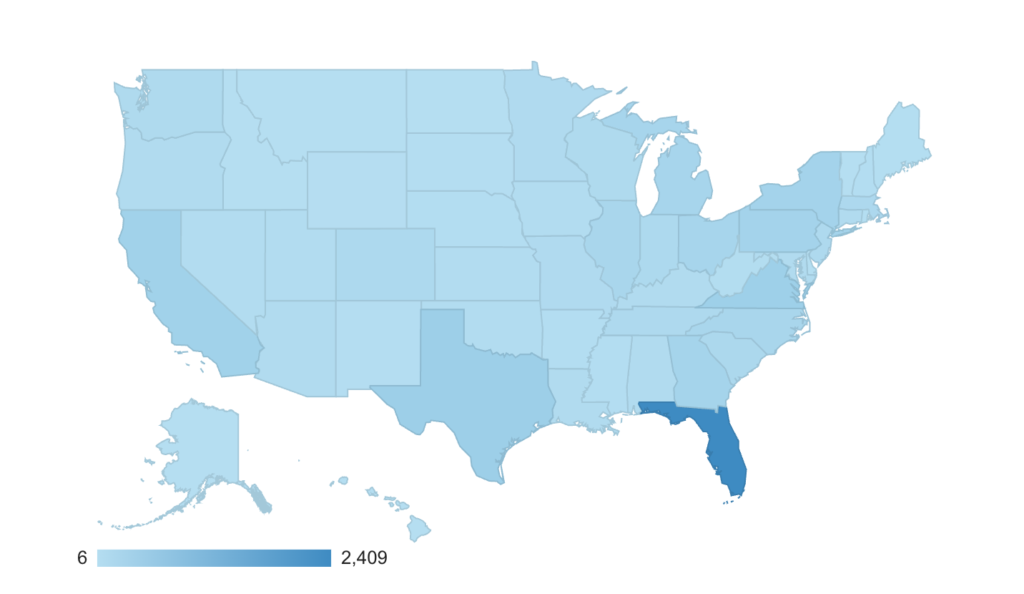
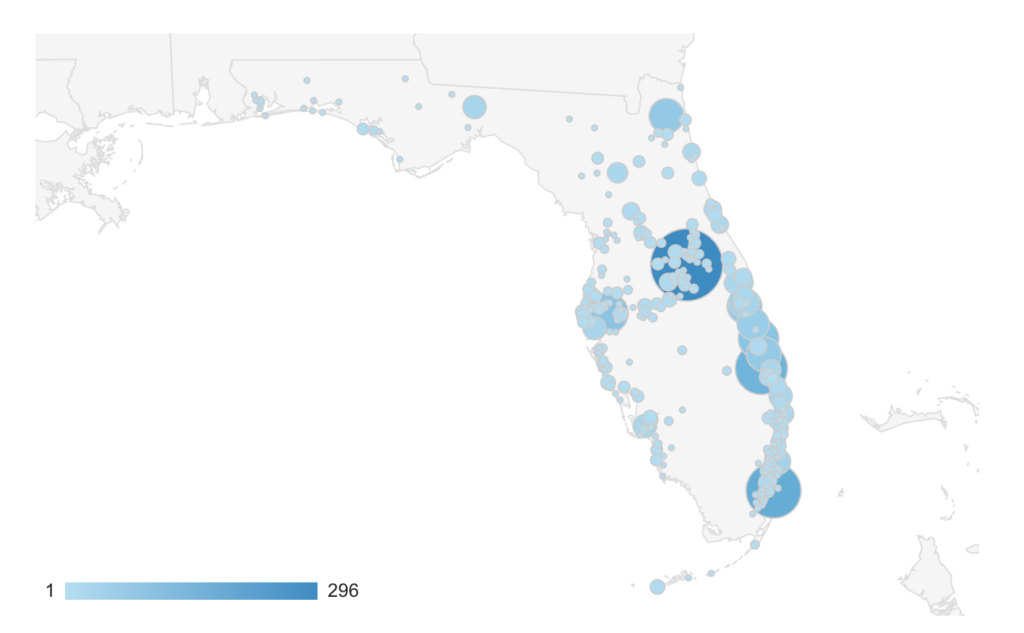
The geography chart listed below shows viewers from all over the country, with the largest visitation from Florida. That state is shown in dark blue denoting the most concentrated traffic. There are also significant contingents that visit the website often from Virginia, California, Texas, Virginia, New York, Ohio, and Pennsylvania, which show as a mid-tone blue.
In the image above, we show the cities in Florida where the most traffic originates from — mostly on the coasts and in Central Florida as well.
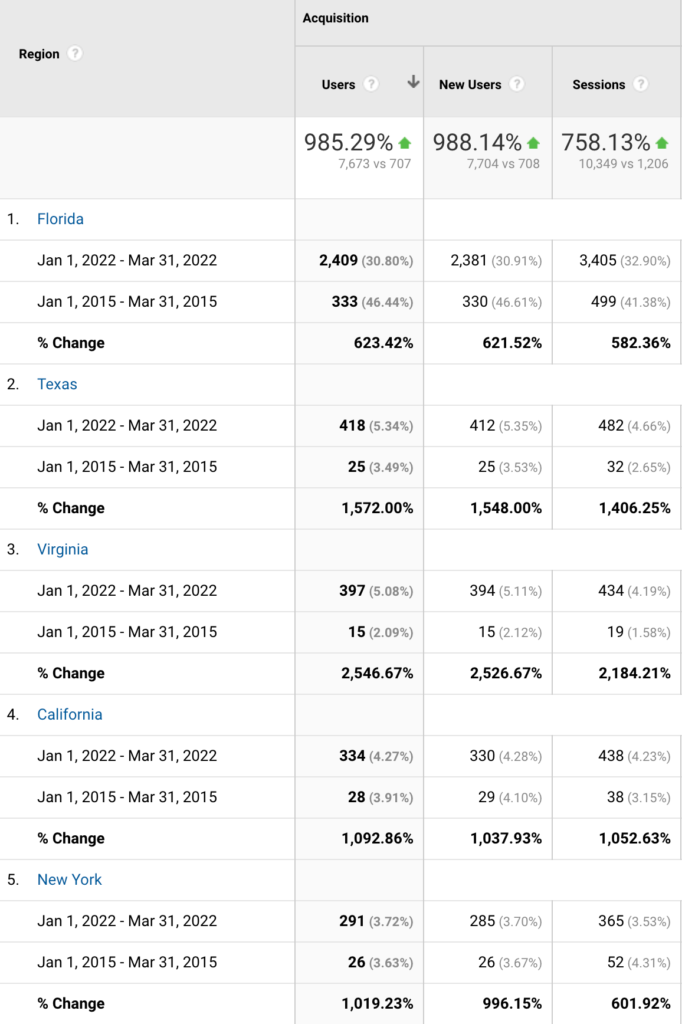
Looking back on the 1715 Fleet Society Web Analytics from the same period in 2015, we can see the user base of the site has spread across the country and increased in nearly every state. What was formerly just a few hits per quarter per state is now hundreds or thousands per state. Check out the top 5 states in terms of traffic for the Fleet Society website. Overall, traffic has increased nearly 1,000% over the past seven years. In some states, the traffic has increased more than 1,000%.
1715 Fleet Society Web Analytics and Popular Pages
The 10 most popular pages for Q1 2022 are:
- History of the 1715 Fleet
- Home Page
- News Archive
- Treasures of the Month Archive
- Article on Corrigan’s beach wreck, which got more than 1,000 views in under a month
- Corrigan’s Beach Wreck Glossary Page
- 1715 Fleet Society Membership Page
- Corrigan’s Wreck Site Tag Page
- History of Real Eight Documents and Letters
- The 1715 Treasure Fleet Exhibit
We created the 1715 Fleet Society Glossary last year to help new members understand and learn important terms, and it’s gratifying to see a glossary item in the top 10 pages for a quarter. Overall, Corrigan’s beach content dominated the top 10 list for the quarter. If you haven’t already, check out #8 in the list above which brings you to a list of 31 posts tagged with “Corrigan’s Beach” or “Corrigan’s Wreck Site” across all articles on the site.
To see the 1715 Fleet Society Web Analytics increase like this over a single quarter is uncommon, though not unexpected. Fleet Society directors and board members posted often during Q1, and our readers also posted an increased number of comments to those articles and shared them throughout social media streams. As a reminder, we use Google Analytics to track web traffic.
Altogether, we’re expecting a 25-30% growth in traffic on the Fleet website this year thanks to our voracious readers, existing and new members, and those we hope to bring into the fold soon.
Thanks for a great quarter!
Craig Grella
Board Member and Web Admin, 1715 Fleet Society
